
Field records become something you can decide on
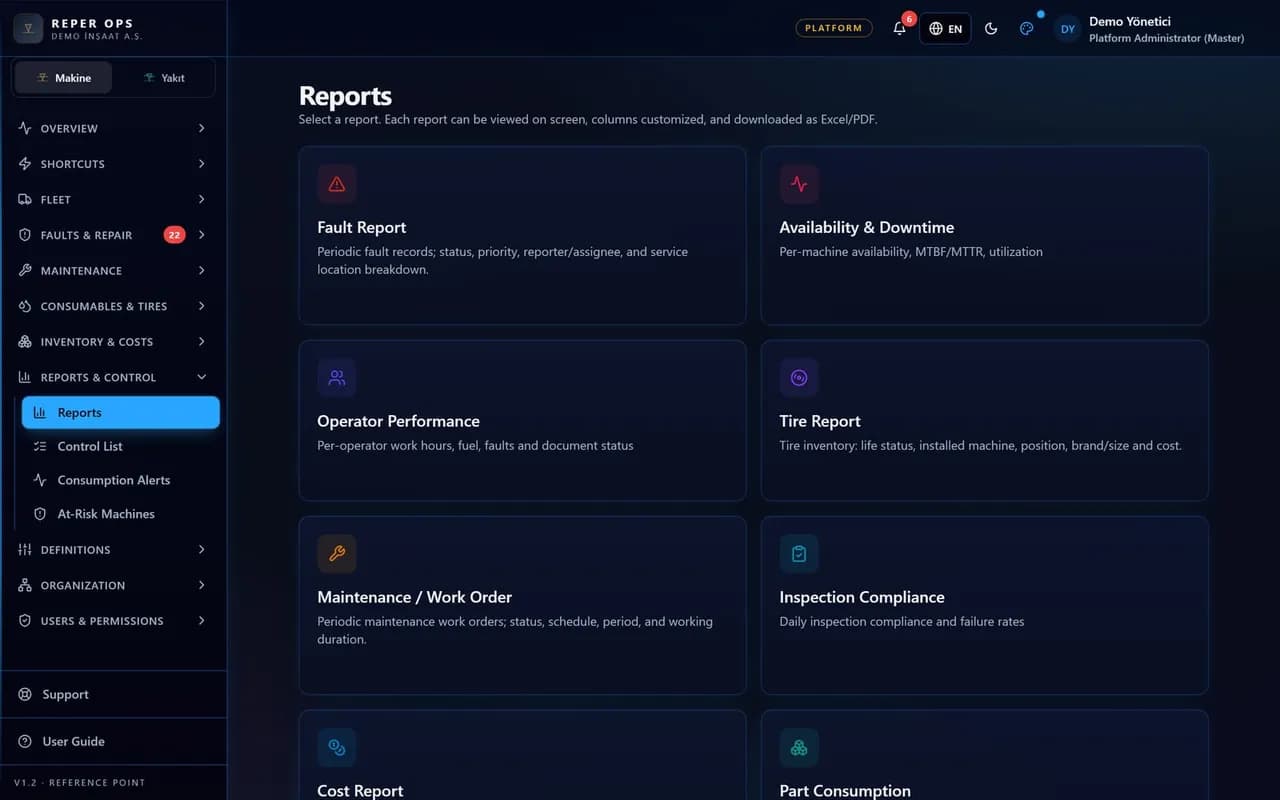
Fault, maintenance, timesheet and consumption records flow into the dashboard and reports without a separate data-gathering effort. Which machine causes trouble and which is at risk shows at a glance.
How the work flows on site
- 01
Records are gathered
Field records flow into the dashboard and reports by themselves.
- 02
The dashboard shows the day
Open faults, overdue maintenance and risky machines are listed by role.
- 03
Measurement
Availability, MTBF and risk score are calculated per machine and per fleet.
- 04
Reports are exported
With project and company filters, Excel and PDF output is ready.
Modules in this solution
Dashboard
The day’s open work and risks on one screen by role; jump from a number straight to the record.
Go to module pageReports
Ready reports from faults to cost narrow to your scope and export to Excel or PDF.
Go to module pageAvailability
Downtime is recorded by itself; availability, MTBF and MTTR are measured per machine.
Go to module pageRisk Score
A risk score from 0 to 100 per machine comes from consumption drift and repeat faults.
Go to module pageArtificial Intelligence
Coming soonSuggests fault triage and a weekly management summary; no suggestion is saved without approval.
Go to module pageLet’s look at it with your machines
Tell us about your fleet and we will show this solution in your scenario.