
Fleet Management Dashboard: Open Work, Risks and Delays at a Glance
The whole day on one screen
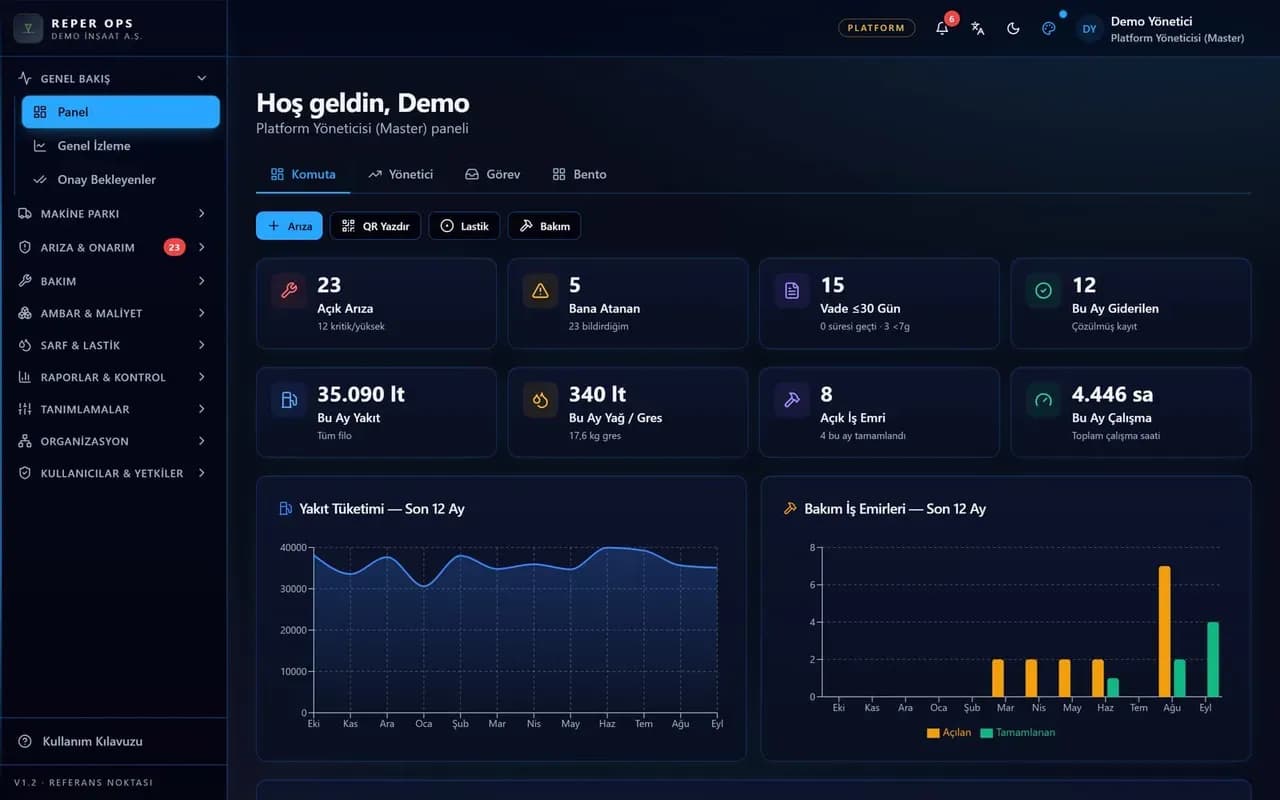
The dashboard ships with four views tailored to different roles: Command, Executive, Task and Bento. Open faults, upcoming and overdue maintenance, high-risk machines, low stock, expiring documents and contracts, fuel deviations and the availability rate are visible at first glance. Every card is one click away from the underlying list.

Four views by role
The Command, Executive, Task and Bento views suit different ways of working. The choice is saved per user, so the same layout opens at every login.
One click from card to record
Clicking a number on the dashboard opens the matching record list already filtered. Work starts without searching through the menu.

Project and company filter
A single selection narrows the whole dashboard to one project or company. Focus is never lost in multi-site organisations.

Critical alerts together
Overdue maintenance, low stock, expiring documents and high-risk machines gather on the same screen. The day starts with solving problems, not looking for them.

Executive summaries
The Executive view presents cost and performance summaries as compact cards. For detail you move on to the report centre.
How it works
- 1
Pick your view
Choose the dashboard view that fits your role and let it be saved.
- 2
Narrow the scope
Apply the project or company filter to focus the screen.
- 3
Take action
Jump from a card to the list and start the fault, maintenance or stock job.
How the fleet management dashboard frames the day
The dashboard is the first screen a user lands on after signing in, and it arrives in one of four views depending on their role: Command, Executive, Task and Bento. The choice is saved per user and the same layout opens at every login. The cards along the top summarise machine count, open faults, upcoming and overdue maintenance; clicking a card opens the matching list already filtered, with no menu searching involved.
The figures on the dashboard cover only the companies, projects, regions and locations within the user's scope. A site supervisor sees the numbers for their own project, while a regional manager sees every project in their region. A single selection can narrow the whole dashboard to one project or company, so focus is preserved in multi-site organisations and the same screen can be read project by project.
The cards a manager sees
Critical alerts gather on the same screen: overdue maintenance, parts below minimum stock, expiring contracts and warranties, expiring operator licences, daily checks not completed today, machines with a location mismatch, fuel deviations and tank levels, consumption anomalies and high-risk machines. The fleet availability card and the five machines with the most downtime summarise the downtime side.
The Executive view presents cost and performance summaries as compact cards, with detail available in the report centre. For managers overseeing several sites, the Overview screen shows machine, fault and maintenance status by project and region in a single table.
How it connects to other modules
The dashboard produces no data of its own; it gathers records created by the fault, maintenance, warehouse, contract, operator, fuel, analytics and availability modules. That is why every number on the dashboard opens into a module list where action begins: from a card you move to a fault detail, a work order or a part card. Fresh data is fetched every time the page opens, and telemetry data is processed as it arrives from the provider.
Who it suits
The site supervisor who starts the day with open work, the maintenance manager reviewing the workshop list and the executive team wanting a weekly summary all use the same dashboard through different views. Small teams focus on the list with the Task view, while multi-site organisations follow the wider picture with the Command view. No separate setup is required; the moment a user is given a role and scope, the relevant cards fill with their own data. A manager who opens the dashboard first thing in the morning learns which fault is waiting, which maintenance is overdue and which part is running low without switching screens, and every card clicked leads straight to the list where the work gets done.
FAQ
Does everyone see the same data on the dashboard
No. The dashboard narrows to the user's role and scope. A site supervisor only sees the figures for their own project.
Do I have to pick my view again at every login
No. The view you select is saved per user. The dashboard opens with the same layout the next time you sign in.

Ready to digitize your equipment fleet?
Take the first step toward a more efficient, more controlled and more profitable operation.