
Field records become something you can decide on
Fault, maintenance, timesheet and consumption records flow into the dashboard and reports without a separate data-gathering effort. Which machine causes trouble and which is at risk shows at a glance.
How the work flows on site
Records are gathered
Field records flow into the dashboard and reports by themselves.
The dashboard shows the day
Open faults, overdue maintenance and risky machines are listed by role.
Measurement
Availability, MTBF and risk score are calculated per machine and per fleet.
Reports are exported
With project and company filters, Excel and PDF output is ready.
Modules in this capability
Dashboard
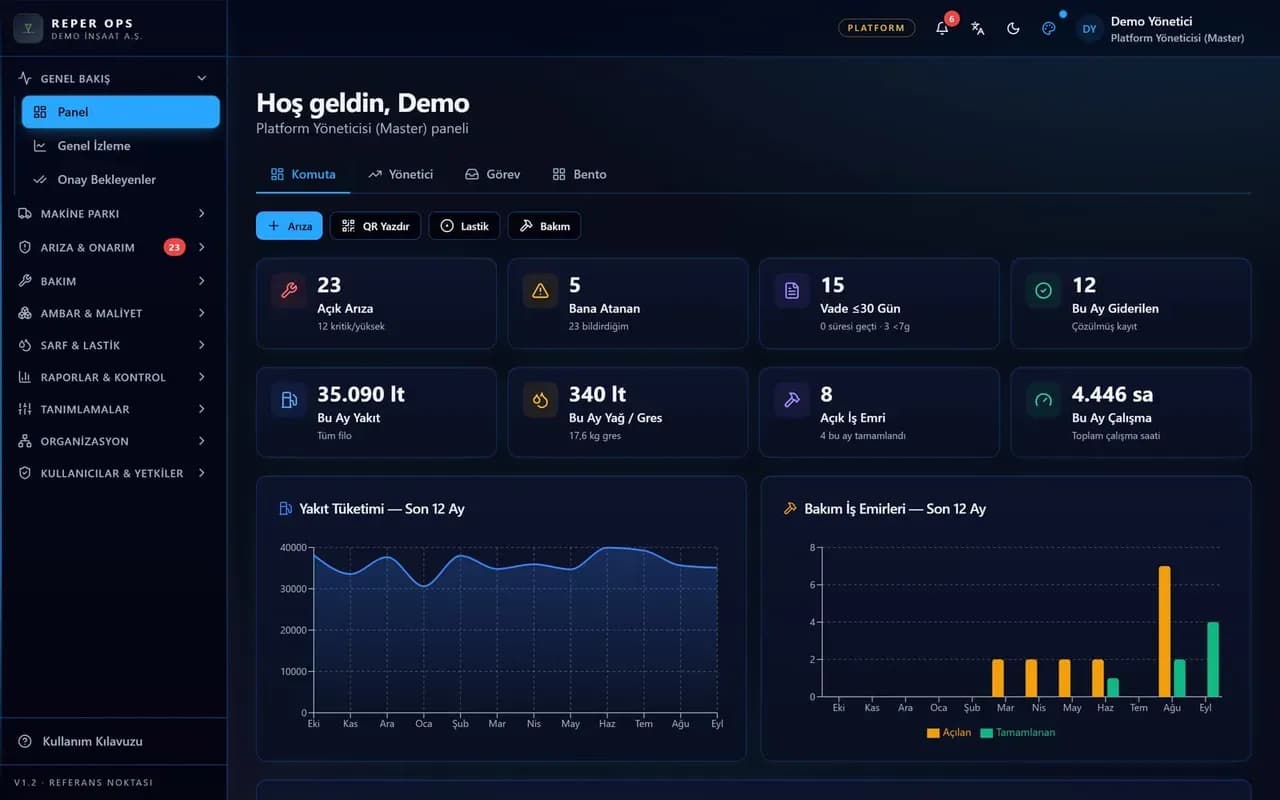
Dashboard
Today's open work, risks and delays on a single screen

Four views by role
The Command, Executive, Task and Bento views suit different ways of working.
One click from card to record
Clicking a number on the dashboard opens the matching record list already filtered.

Project and company filter
A single selection narrows the whole dashboard to one project or company.
Reports
Reports
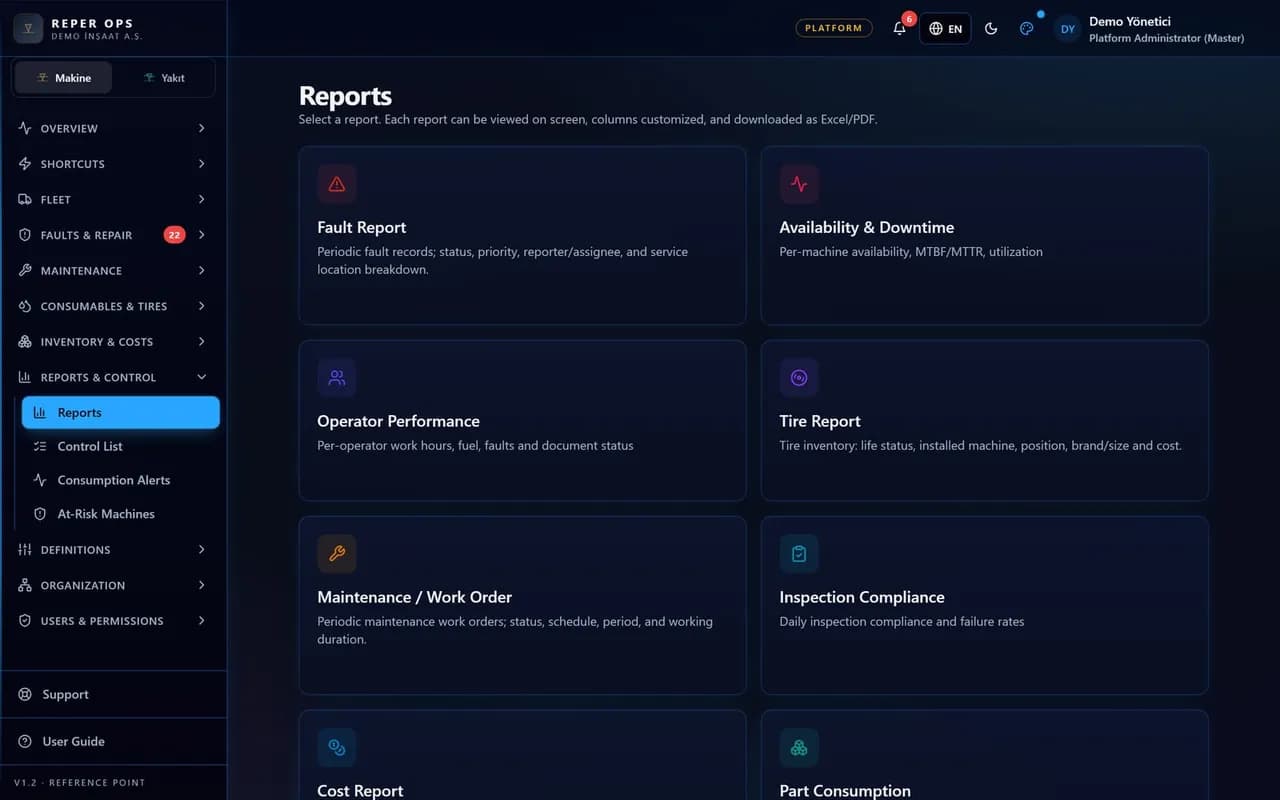
Ready-made tables from faults to cost, with Excel and PDF output

Purpose-built ready reports
Every report answers one specific question, so no complex report design is needed.
A shared filter set
Project, company, machine group and date range work identically across every report.

Results narrowed by scope
Users only see data for the projects and companies they are entitled to.
Availability
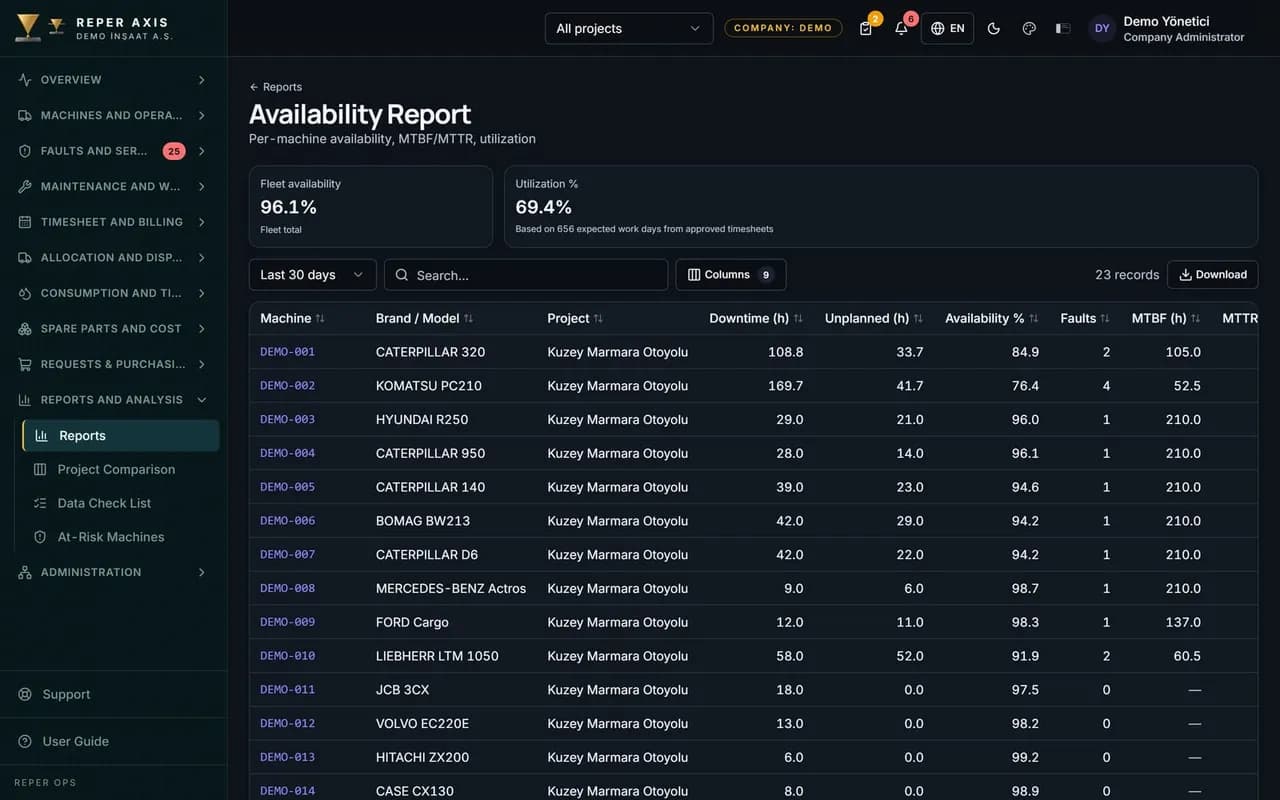
Availability
Downtime hours, availability rate, MTBF and MTTR

Automatic downtime logging
Faults that stop a machine, maintenance work orders and transfers are all recorded as downtime.
Planned working hours
Planned daily hours are defined per company, machine group or individual machine.
MTBF and MTTR
Mean time between failures and mean time to repair are measured per machine and across the fleet.
Risk Score
Risk Score
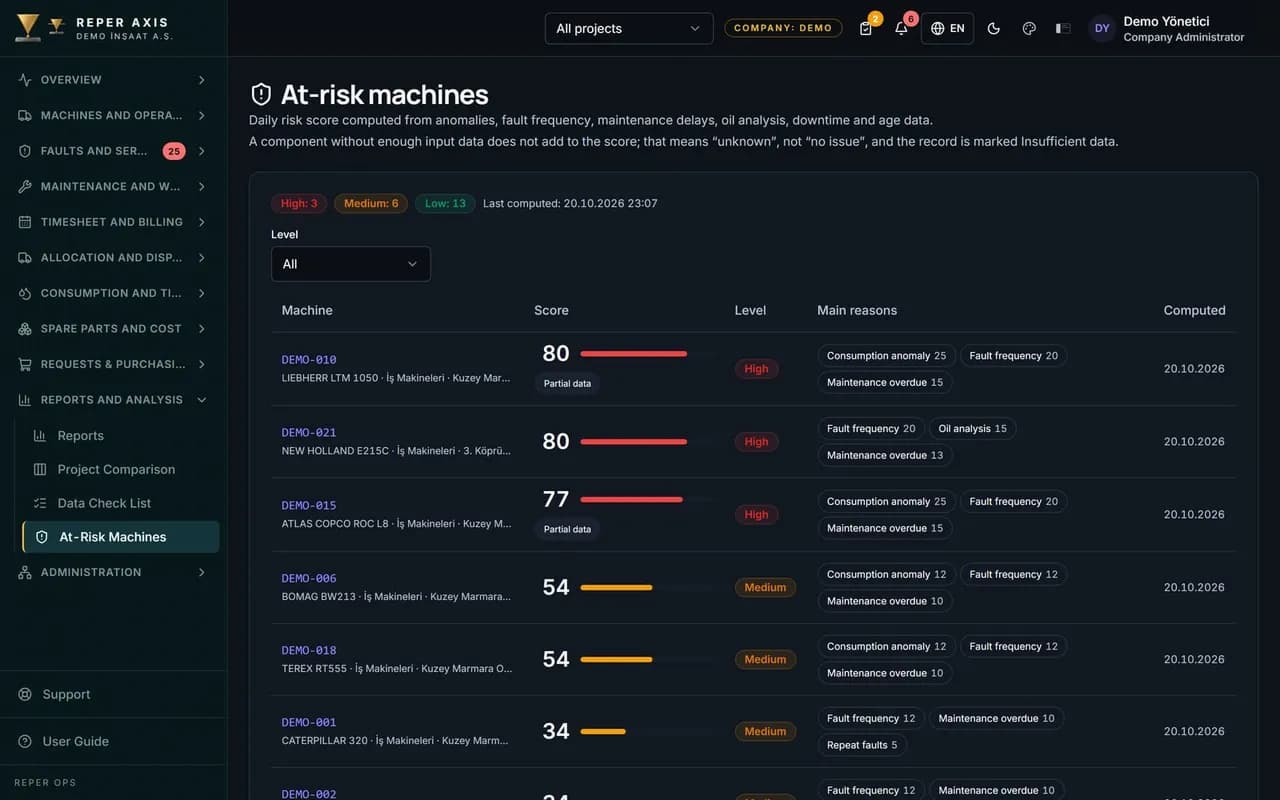
Machine risk calculated from anomalies and fault history

Consumption anomalies
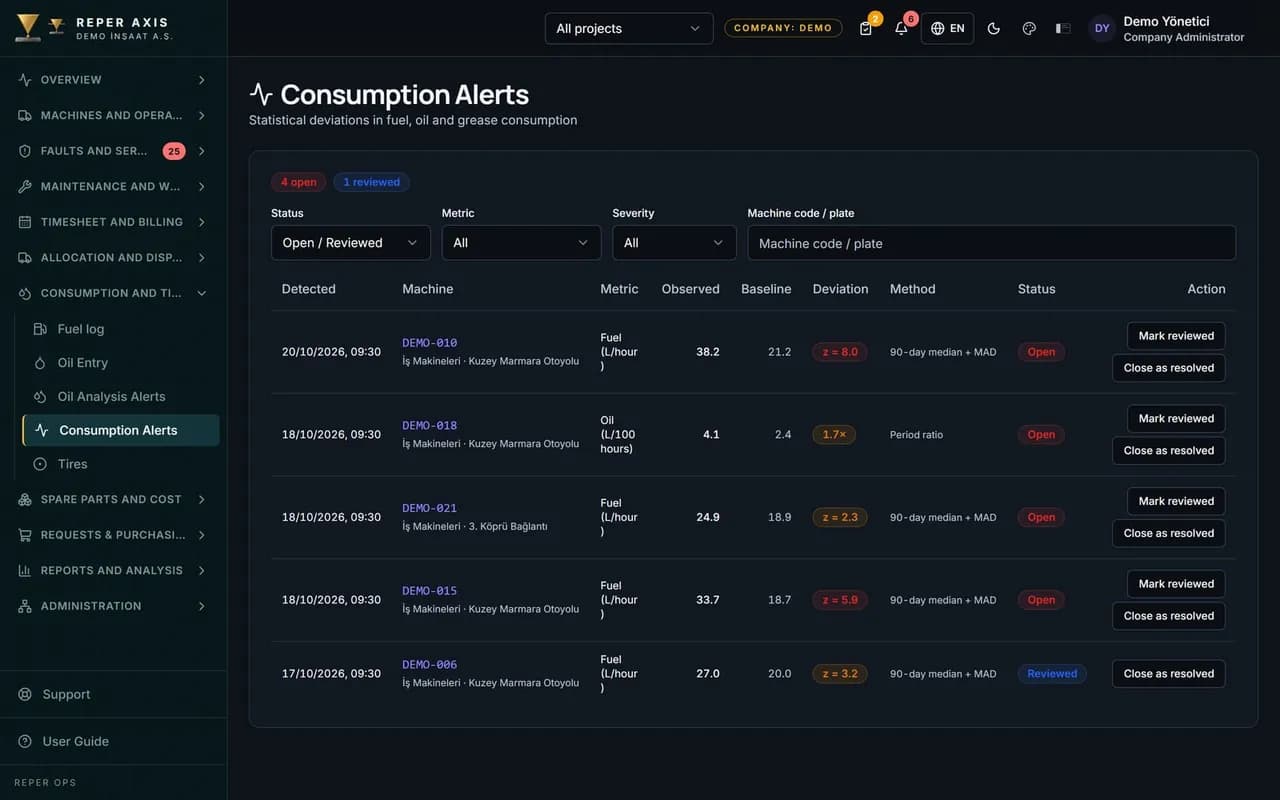
Sudden rises or drops in fuel, oil and grease consumption land on the alert list.

Repeat fault detection
Records opened in the same category at short intervals push the score up.

Component breakdown
What pushed the score up is shown item by item on the machine card.
Artificial Intelligence
Artificial Intelligence
Fault triage, data scanning and weekly summary; approval-based and budget-controlled

Fault triage
From the free text written by field staff, category, priority and whether the machine can keep operating are suggested; rationale and confidence level are shown.
Similar past faults
On the fault detail page, past records on the same machine with similar text are listed with resolution notes.

Data quality findings
Every night meter rollback, physically impossible meter jumps, faults repeated within 48 hours and repeat faults four or more times in 90 days are scanned.
Dashboard
Today's open work, risks and delays on a single screen
Four views by role
The Command, Executive, Task and Bento views suit different ways of working.
One click from card to record
Clicking a number on the dashboard opens the matching record list already filtered.
Project and company filter
A single selection narrows the whole dashboard to one project or company.

Let’s look at it with your machines
Tell us about your fleet and we will show this capability in your scenario.