
Equipment Availability, MTBF and MTTR: Downtime Tracked Automatically
How long did the machines actually run
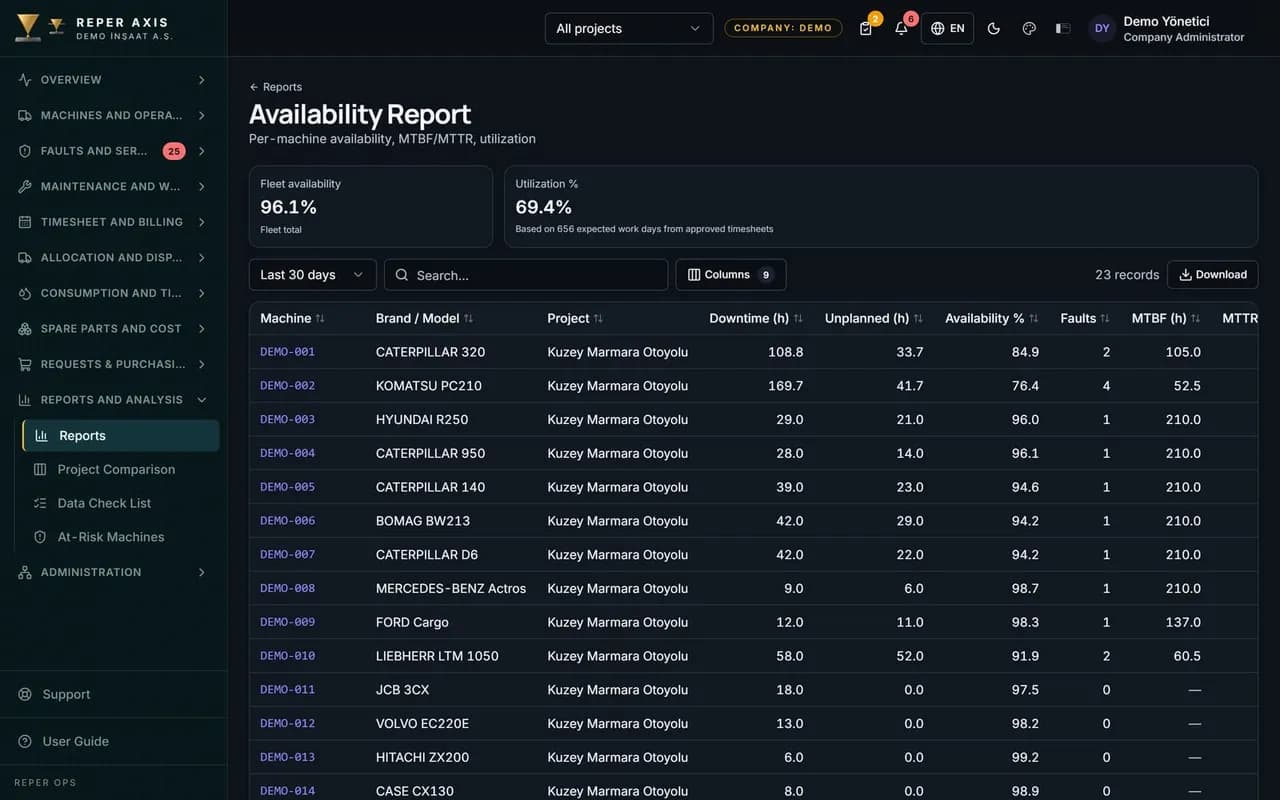
Downtime is not tracked by hand: an out-of-service fault, a maintenance work order and a job site transfer each start a downtime record on their own. The availability rate, mean time between failures and mean time to repair are calculated against your planned daily working hours. Results are reported at fleet and machine level.

Automatic downtime logging
Faults that stop a machine, maintenance work orders and transfers are all recorded as downtime. There is no separate downtime form to fill in.

Planned working hours
Planned daily hours are defined per company, machine group or individual machine. The availability rate reflects how you actually work.

MTBF and MTTR
Mean time between failures and mean time to repair are measured per machine and across the fleet. Whether your maintenance strategy is working becomes a number.

Machines with the most downtime
The machines with the highest downtime hours are listed first on the dashboard. Which machine really causes trouble stops being a matter of opinion.
Downtime chart by cause
Downtime hours over the last 12 months are shown on a chart broken down by cause. Whether faults, maintenance or transfers dominate becomes clear.

Manual correction with permission
Where necessary, an authorised user can correct a downtime record. The change is written to the audit trail.
How it works
- 1
Define planned hours
Enter planned daily working hours per company, group or machine.
- 2
Let operations run
Fault, maintenance and transfer records create downtime automatically.
- 3
Read the KPIs
Availability rate, MTBF and MTTR are tracked in reports and on the dashboard.
How equipment availability, MTBF and MTTR are calculated
No separate form is filled in for downtime. When a fault form is marked as machine out of service, fault downtime begins; it ends when the fault is closed or the machine becomes operable again. Starting a work order creates maintenance downtime, and recording a job site transfer creates transfer downtime. Availability is found by subtracting downtime hours from the planned working hours in the period and dividing by the planned hours.
MTBF is the mean operating time between two failures, while MTTR is the average time taken to resolve a failure. Both are measured per machine and across the fleet, so whether the maintenance strategy is working becomes visible as a number.
Planned working hours are yours to set
On the Settings page the manager enters the fleet-wide planned daily working hours, defaulting to 8 hours. If a machine group runs a different pattern, the value is overridden in the Machine Groups definition; for a single machine the Planned Daily Hours field on the machine form is used. Planned hours apply to every day, and machines with an unusual working pattern take a machine-level value.
What the manager sees
On the Performance tab of the machine card, availability percentage, MTBF, MTTR and utilisation are read from the top cards. The 12-month downtime chart shows downtime hours by month broken down by cause, making it clear whether faults, maintenance or transfers dominate. The list underneath groups downtime records by type. On the dashboard the fleet availability card and the five machines with the most downtime give a quick summary, while the Availability Report under Reports compares machines, groups or projects.
Where necessary, a user with the Edit Downtime permission adds or corrects downtime manually from the Performance tab; the KPI values refresh immediately and the change is written to the audit trail. Automatic records are managed through their source fault or work order.
How it connects to other modules and who it suits
Availability data is fed by the fault, work order and transfer modules, and downtime hours are also one of the components of the risk score. Marking a fault as out of service affects not just the fault list but the availability percentage of that machine and the fleet average at the same time. That is why the field team filling in the fault form correctly pays off directly on the KPI side.
It suits executives who want the real utilisation rate per machine, maintenance managers measuring their strategy and fleet managers deciding whether to rent. It is one of the most used screens in teams who want to settle the argument about which machine really causes trouble with a number.
FAQ
How does downtime start and end
Downtime starts when a fault that stops the machine is opened and ends when the fault is closed. Maintenance work order and transfer durations are recorded with the same logic.
What is the availability rate based on
The planned daily working hours you define are compared against the recorded downtime hours. Planned hours can differ by machine group.


Ready to digitize your equipment fleet?
Take the first step toward a more efficient, more controlled and more profitable operation.