
Machine Prioritization: Maintenance Order with Risk Score
See which machine to service first
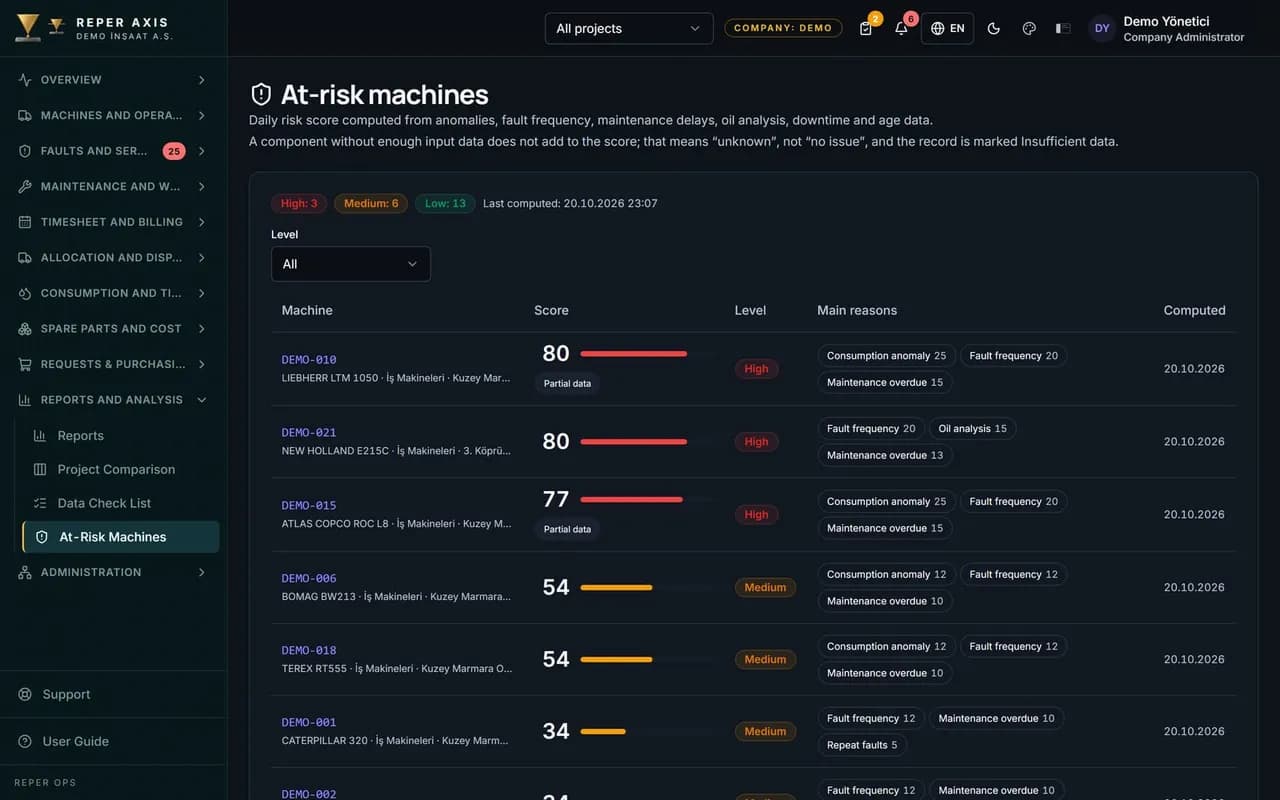
Reper Axis monitors fuel, oil and grease consumption statistically and turns deviations from a machine's own history and from its group into alerts. The risk score, on a scale of 0 to 100, is recalculated every night from anomalies, fault frequency, repeat faults, overdue maintenance, oil analysis, downtime and machine age. Component caps total 105 points; the score is clamped to 0–100 so no single component fills the score alone. The result shows which machine to service first.

Consumption anomalies
Sudden rises or drops in fuel, oil and grease consumption land on the alert list. The comparison is made against the machine's own history and its group.

Repeat fault detection
Records opened in the same category at short intervals push the score up. Problems that were never properly solved turn into a number.

Component breakdown
What pushed the score up is shown item by item on the machine card. You see the reason before you trust the alert.

Alert follow-up
Alerts are acknowledged and closed once resolved. No alert is left hanging without an owner.

Action by risk level
At low level the routine plan continues, at medium level inspection frequency increases, and at high level a preventive work order is opened and parts are prepared.

Top of the dashboard
High-risk machines stand out on the dashboard and risk list; you use that information to decide which machine should take critical work.
How it works
- 1
Data accumulates
Fuel, oil, meter, fault and downtime records are recorded to the machine.
- 2
Deviations are found
Consumption is compared with the machine's own history and its group.
- 3
The score is calculated
The risk score is refreshed every night on a 0 to 100 scale.
- 4
Action is taken
A preventive work order is opened for the risky machine and parts are staged.
How the prioritization score is built
Reper Axis runs two calculations every morning. First comes the consumption anomaly scan: a machine's fuel litres per hour over the last 7 days is compared with its own 90-day history and with its group, while oil and grease consumption per 100 hours over the last 30 days is compared with the preceding 90 days. Reaching 1.5 times normal is a warning level and 2.5 times is critical.
The risk score is then calculated between 0 and 100. The components and their weights are fixed: consumption anomaly 25, fault frequency 20, repeat faults 10, maintenance delay 20, oil analysis 15, downtime 10, and machine age with hours 5 points. Component caps total 105 points; the score is clamped to 0–100. High level is 60 and above, medium is 30 to 59, and low is below 30.
What the manager sees
The Risky Machines page under Reports and Control gives a list ordered by score; levels are separated by colour and the manager can refresh the score instantly with Recalculate. The Consumption Alerts page offers alert type, level and status filters; an alert is marked as Reviewed and set to Resolved once the problem is fixed. When the anomaly disappears, the alert resolves itself.
The risk card on the Health tab of the machine card lists the score, the level and the main reasons, so what pushed the score up is visible item by item. The KPI cards show litres per hour over the last 7 days, fault frequency and maintenance delay; on the 90-day fuel chart a reference line marks the machine's normal band, and points outside the band are anomalies.
Action by risk level
At low level the routine plan continues. At medium level inspection frequency is increased and checklist items are reviewed. At high level a preventive work order is opened without waiting for the plan and parts are reserved in advance. High-risk machines stand out on the dashboard and risk list; you use that information to decide which machine should take critical work. The anomaly and high-risk machine cards on the dashboard carry that decision into the morning list.
How it connects to other modules and who it suits
The score is fed by the fuel, oil tracking, meter, fault, maintenance program, oil analysis and availability modules; an area with no data entry contributes nothing to the score. On a new deployment the score stays hidden until enough meter and fuel history has built up; anomaly alerts come first and the full score follows in later weeks. It suits maintenance managers and fleet managers who want to intervene before a breakdown, and it pays off most in fleets that record meter and fuel data consistently.
FAQ
What is the risk score based on
Consumption anomalies, fault frequency, repeat faults, overdue maintenance, oil analysis results, downtime hours and machine age are evaluated together. The contribution of each component is shown separately on the machine card.
How often is the score updated
The calculation runs automatically every night and the current score is ready on the dashboard in the morning. The ranking shifts as new data is entered.
Is the score meaningful on a new deployment
Because the score relies on historical data, it becomes more accurate as records accumulate. Anomaly alerts come first, and the full score follows in later weeks.


Ready to digitize your equipment fleet?
Take the first step toward a more efficient, more controlled and more profitable operation.