
Fleet and Maintenance Reports: Ready Tables with Excel and PDF Export
Tables that are ready for decisions
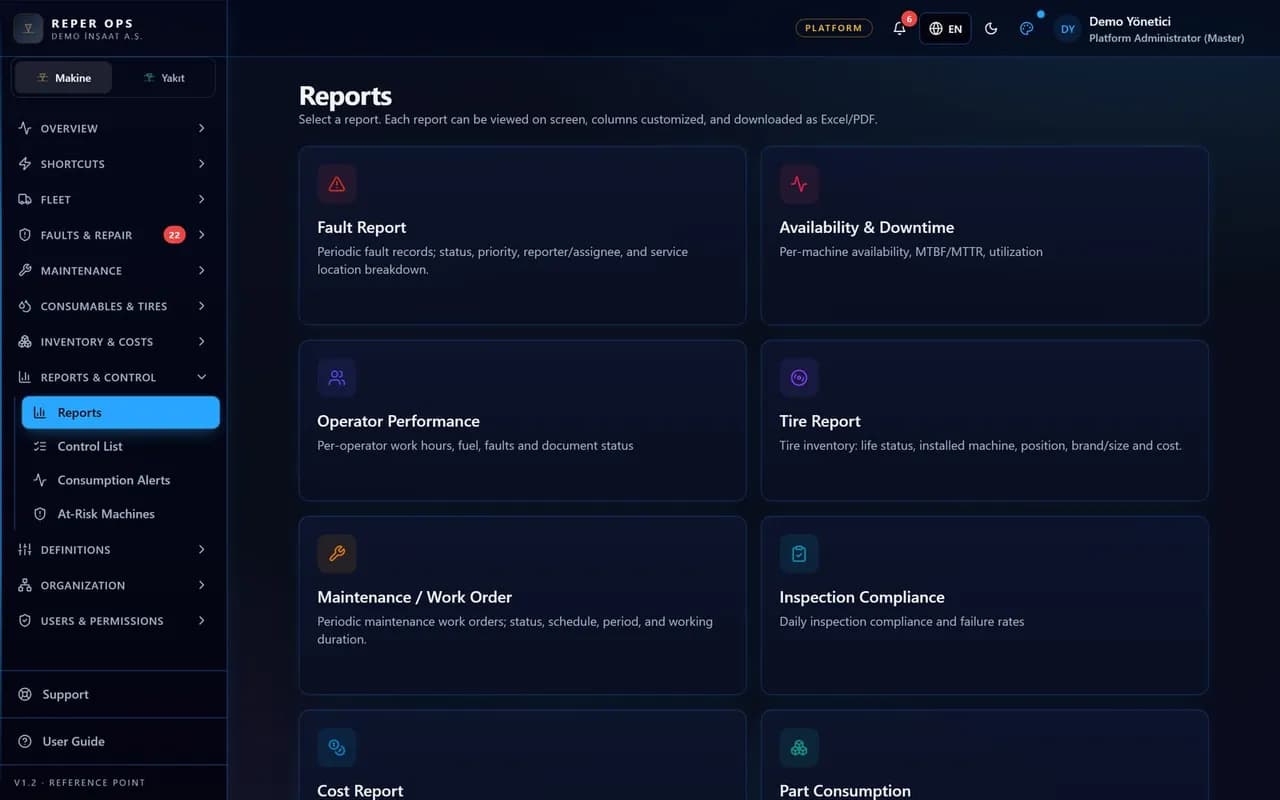
Fault, maintenance, work order, cost, inventory, availability, operator, fuel per hour, tyre and oil analysis reports come ready out of the box. They are narrowed with project, company, machine group and date filters. Every table can be exported to Excel and PDF, and each export is written to the audit trail.

Purpose-built ready reports
Every report answers one specific question, so no complex report design is needed. You reach the answer without wrestling with drag and drop builders.

A shared filter set
Project, company, machine group and date range work identically across every report. What you learn in one report applies to all the others.

Results narrowed by scope
Users only see data for the projects and companies they are entitled to. A report run by a site supervisor never reaches beyond their own project.

Excel and PDF output
The filtered table is exported in a single click. Preparing a file for a meeting takes no extra work.

Exports on the record
Who downloaded which report and when is written to the audit trail. Data sharing stays traceable.
How it works
- 1
Pick the report
Open the heading that matches your need from the report centre.
- 2
Apply the filters
Set the project, machine group and date range.
- 3
Export
Download the table as Excel or PDF and share it.
How fleet and maintenance reports are produced
The Reports menu is built from ready report cards: machine summary, fault, maintenance and work order, cost, inventory, availability, MTBF and MTTR, operator, fuel per hour, tyre, oil analysis and audit trail reports. The user opens a card, picks this month, last month, the last 30 days or a custom range from the period selector, then narrows the table with the search box, status filter and Columns menu.
Each report is designed to answer a single question; there is no drag and drop report designer and the learning curve is low. Project, company, machine group and date range filters behave the same way in every report, so the habits learned in one carry over to the rest.
Excel and PDF export
Excel or PDF is chosen from the Download button at the top right. The export uses the filters applied on screen and the columns selected in the Columns menu, so checking the filters before downloading is enough. Preparing a file for a meeting requires no extra work. Every download is written to the audit trail with the user and timestamp, so it is always known which data left the system and when.
What the manager sees and how scope applies
Report results narrow automatically to the user's role and scope. A cost report run by a site supervisor never reaches beyond their own project, and machines outside that scope never enter the table. The cost report shows the total per machine along with the labour, parts, external service, other, rental, transfer and fuel breakdown; clicking a row opens the work order and fault list for that machine. The availability report compares percentage and downtime hours by machine, group or project.
How it connects to other modules and who it suits
Reports require no separate data entry; they are generated from the records accumulating in the fault, work order, warehouse, fuel, tyre and oil analysis modules. A fault opened in the field via QR or a work order closed in the workshop lands in the report table the same day with no extra step. The Reports module must be enabled on the role, and the cost report additionally requires the View Cost permission. The Show All and Reset to Default options in the Columns menu help tidy the table quickly.
It suits the finance team preparing the monthly management meeting, the fleet manager comparing cost per machine and the executive team wanting a summary without visiting the site. It is built for users who would rather filter and download a ready table than design a report.
FAQ
Which reports come as standard
Fault, maintenance, work order, cost, inventory, availability, MTBF and MTTR, operator, fuel per hour, tyre, oil analysis and audit trail reports ship ready. They all use the same filter set.
How is report data limited
Report results narrow automatically to the user's role and project scope. Machines outside that scope never enter the table at all.


Ready to digitize your equipment fleet?
Take the first step toward a more efficient, more controlled and more profitable operation.