
Oil Analysis Tracking: Laboratory Results and Consumption Trends
See inside the engine without opening it
Oil and grease top-ups are posted to the machine and consumption is tracked per 100 engine hours. Results from samples sent to the laboratory are recorded with measurements such as viscosity, iron, copper, silicon, water, soot and TBN. Every sample is assessed with trend arrows and a status of normal, caution or critical.

Consumption tracking
Oil and grease top-ups are posted to the machine and consumption per 100 hours is calculated. A sudden rise becomes an anomaly alert.

Laboratory result records
Wear metal, contamination and chemical measurements are entered per sample. The values are followed on a trend chart in the oil analysis tab of the machine card.
Report attachments
The PDF sent by the laboratory is attached to the sample record. The document stays in the machine's history instead of being hunted for in folders.

Status notifications
Results that come back as caution or critical are sent to the relevant people as notifications. Nobody waits for a report to make a decision.

Impact on the risk score
A critical analysis result raises the machine's risk score. A preventive work order is raised for a machine with a rising score without waiting for the plan.
How it works
- 1
Take the sample
An oil sample is taken during maintenance and sent to the laboratory.
- 2
Record the result
The measurements are entered and the laboratory report is attached.
- 3
Read the trend
Wear metal and contamination trends are followed on the machine card chart.
- 4
Take action
A critical result raises a notification and the risk score, and opens a work order.
Oil analysis tracking: from sample to record
The oil sample taken during maintenance is sent to the laboratory. When the result arrives, New analysis is opened on the Oil analysis tab of the machine detail; the sample date, oil type, engine hours, laboratory and sample number are entered. The result is set as Normal, Caution or Critical. The measurements are recorded one by one: viscosity; iron, copper, silicon, aluminium, chromium and lead in ppm; water, soot and fuel dilution as percentages; TBN and TAN. The laboratory recommendation and a note are written in, and the report file is attached as a PDF or an image.
Engine hours are entered from that day's meter reading, because the trend charts compare on an hours basis. The report file is not mandatory but is recommended for retrospective verification. The Manage Oil Analysis permission is required to record one.
The consumption side: oil and grease entries
On the Oil Entry page the machine is selected, the oil type and quantity are entered and the reason is chosen: topping up the level or a scheduled change. Bulk import from Excel is done with the import button on the same page. New types and units are defined on the Oil Types page. Consumption is calculated per 100 engine hours; the last 30 days are compared with the previous 90, and a 1.5 times deviation lands on the Consumption Alerts page as a warning while a 2.5 times deviation lands there as critical.
Trends and alerts: what the manager sees
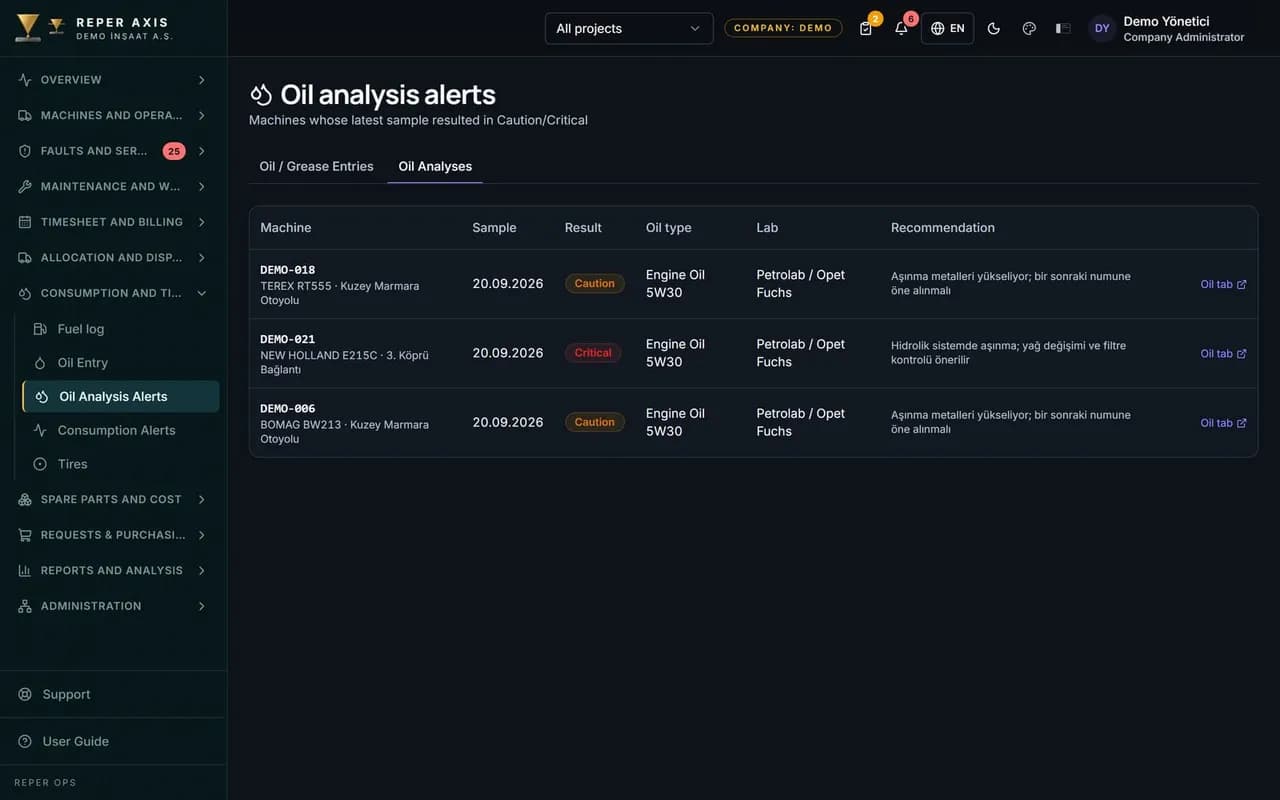
The table on the oil analysis tab shows an up or down trend marker for each measurement against the previous sample; in the chart area a metric is selected, for example iron or viscosity, and the time series is followed. The Oil Analysis Alerts page lists machines whose latest sample came back as Caution or Critical. On such a result, a notification goes to the relevant people, a warning to bring the oil change stage forward appears on the tab, and the maintenance tab can be reached from there. The laboratory report stays in the machine's history instead of being hunted for in folders.
How it connects to the other modules and who it is for
The oil analysis result is one of the components of the risk score; a critical result raises the score and moves the machine up the Risky Machines list. An oil change brought forward is raised as a preventive work order through the maintenance program, and the oil and filters used are consumed from the warehouse and posted to cost. Oil consumption is read alongside the fuel anomaly on the machine's Health tab. It suits maintenance teams running high-hour heavy equipment that carries major overhaul risk in the engine, transmission and hydraulic systems, and who keep losing laboratory reports in their email inbox.
FAQ
Which measurements can be recorded
Common laboratory parameters such as viscosity, iron, copper, silicon, water, soot and TBN can be entered. A trend arrow and a status assessment are shown for each parameter.
Is oil consumption meaningful on its own
Consumption becomes meaningful once it is compared with the machine's own history and with machines in the same group. When a deviation is detected, an anomaly alert is raised.


Ready to digitize your equipment fleet?
Take the first step toward a more efficient, more controlled and more profitable operation.