
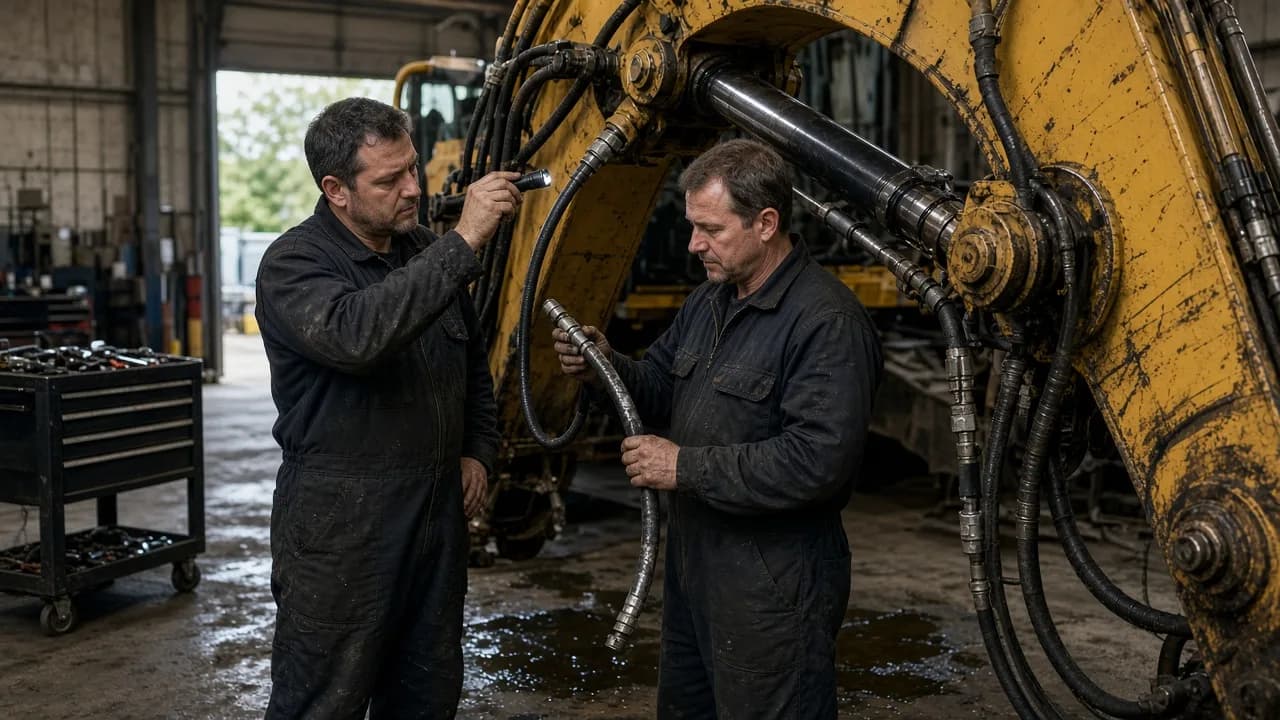
Where does heavy equipment failure root cause analysis start?
Heavy equipment failure root cause analysis makes visible the difference between removing a symptom and eliminating the failure. Replacing the same hydraulic hose for the third time is not a different failure each time. Unless the hose routing, pressure spike, wrong part, installation technique or operating condition changes, the record is closed but the problem keeps happening. The purpose of the analysis is not to find someone to blame but to explain the recurrence mechanism with evidence.
The starting point is a well-written fault record. It should contain the machine, date, meter, category, symptom, operating condition, whether the machine can operate, the stoppage start and the machine ready time together. Photos and the mechanic observation are supporting material, but they are not a root cause on their own. The statement that a part was replaced describes the fix; it does not describe why the part failed.
Set the scope of the analysis narrow and measurable. Instead of every failure across the whole fleet, choose a problem statement such as hydraulic failures that caused production loss in the last six months, or electrical outages in the same model group. If the scope is too wide, the causes become generic; if it is too narrow, the systematic pattern is not visible. For each analysis, the owner, data period, affected machines and success criterion should be written down in advance.
- The problem statement should name a specific machine group, failure type and period
- Symptom, intervention and verified cause should be treated as separate fields
- The stoppage start and the machine ready time should be consistent
- The success criterion should be chosen before the action starts
Which failure to focus on with Pareto?
A Pareto review shows whether a small number of failure groups make up most of the total loss. Looking only at the failure count here is misleading. Ten repeats of a five-minute sensor warning and two three-day transmission stoppages do not have the same priority. Prepare at least three views: failure count, total downtime hours and maintenance spend. For operations, total downtime hours is often the first ranking criterion.
Standardise the categories first. If hydraulic leak, hose burst and oil leak are different spellings of the same event, the analysis is split. On the other hand, grouping internal pump wear and an external connection leak in a single category also hides the cause. The category dictionary should be simple enough for the mechanic in the field to choose easily, and detailed enough to preserve the engineering distinction.
Run the Pareto separately for machine, failure type and the intersection of the two. A failure that looks small in the fleet total can account for most of the downtime on a single critical machine. Also check for seasonal effects. An electrical failure that increases in rainy periods can get lost in the average of the annual total. After the first ranking, open a detailed investigation for the two or three problems causing the highest loss; do not try to solve dozens of topics at once.
- Ranking by failure count
- Ranking by total downtime hours
- Total loss by machine
- Intersection of machine and failure type
- Breakdown by period, shift and operating condition
A step-by-step numerical Pareto, MTBF and MTTR example
The figures below are an example. Let us assume a group of five machines produced 7,200 working hours in the last three months. The downtime records show 8 failures and 96 hours for hydraulics, 12 failures and 36 hours for electrical, 3 failures and 45 hours for the engine, 2 failures and 18 hours for the undercarriage, and 5 failures and 15 hours for other. The total number of failures is 30 and total downtime is 210 hours.
The first step is to calculate the downtime Pareto shares. The hydraulic share is 96 divided by 210, which equals 45.7 percent. The engine share is 45 divided by 210, which equals 21.4 percent; the electrical share is 36 divided by 210, which equals 17.1 percent; the undercarriage 8.6 percent; other 7.1 percent. Hydraulics and engine together create 141 hours of downtime. Since 141 divided by 210 equals 67.1 percent, the first investigation is directed at these two groups. Although electrical is first by failure count, hydraulics is first by downtime impact.
The second step is the MTBF value. MTBF means mean time between failures. The group MTBF is 7,200 working hours divided by 30 failures, which equals 240 hours. For hydraulics specifically, if the total working time of the machines exposed to these failures in the period is taken as 4,000 hours, the hydraulic MTBF is 4,000 divided by 8, which equals 500 hours. The third step is the MTTR value. MTTR means mean time to repair. The overall MTTR is 210 downtime hours divided by 30 failures, which equals 7 hours. The hydraulic MTTR is 96 divided by 8, which equals 12 hours.
In a three-month comparison after the example action, let the same scope have worked 4,100 hours and produced 5 hydraulic failures and 35 hours of hydraulic downtime. The new hydraulic MTBF is 4,100 divided by 5, which equals 820 hours; the new hydraulic MTTR is 35 divided by 5, which equals 7 hours. MTBF has risen from 500 hours to 820 hours, and MTTR has fallen from 12 hours to 7 hours. Downtime intensity was 96 divided by 4,000, which equals 2.4 percent per working hour before, and 35 divided by 4,100, which equals about 0.85 percent after. This result gives a positive signal; even so, firm causality is not claimed until differences in operating conditions and sample are checked.
- Overall MTBF in the first period: 240 hours
- Overall MTTR in the first period: 7 hours
- Hydraulic MTBF change: from 500 hours to 820 hours
- Hydraulic MTTR change: from 12 hours to 7 hours
- Hydraulic downtime intensity: from 2.4 percent to about 0.85 percent
Moving from symptom to mechanism with 5 Whys
The 5 Whys method does not mean mechanically asking why five times to the same question. Each answer must give an evidenced transition to the next question. Let the example problem be the boom hose of an excavator bursting for the third time in two months. First why: the hose wore through on its outer surface. The evidence is the rub mark around the burst and a photograph. Second why: the hose touched the edge of a clamp during boom movement. The evidence is the contact point seen in a movement test.
Third why: at the last replacement the hose was not secured in the routing position given in the service instruction. Fourth why: a clamp of a different diameter was used because the proper clamp was not in stock. Fifth why: no standard had been defined for equivalent parts and stock replenishment for critical hose fittings. In this way the root cause is not left as only the mechanic installation error; the material standard and the work method are addressed together.
Every branch does not have to end in a single root cause. If there is also a sign of excess pressure, pressure control becomes a separate branch in addition to the routing problem. The moment an answer turns into an assumption, stop the chain of questions and open a verification task. Saying that the pump pressure is high without measuring is a guess, not analysis. The root cause statement should describe a changeable system condition and how this condition led to the symptom.
- Does every why answer have a basis in observation, measurement or records?
- Where human error is cited, were the work method and system condition questioned?
- Were multiple independent cause branches separated?
- Are assumptions and verified findings clearly distinguished?
Screening possible causes thoroughly with a fishbone diagram
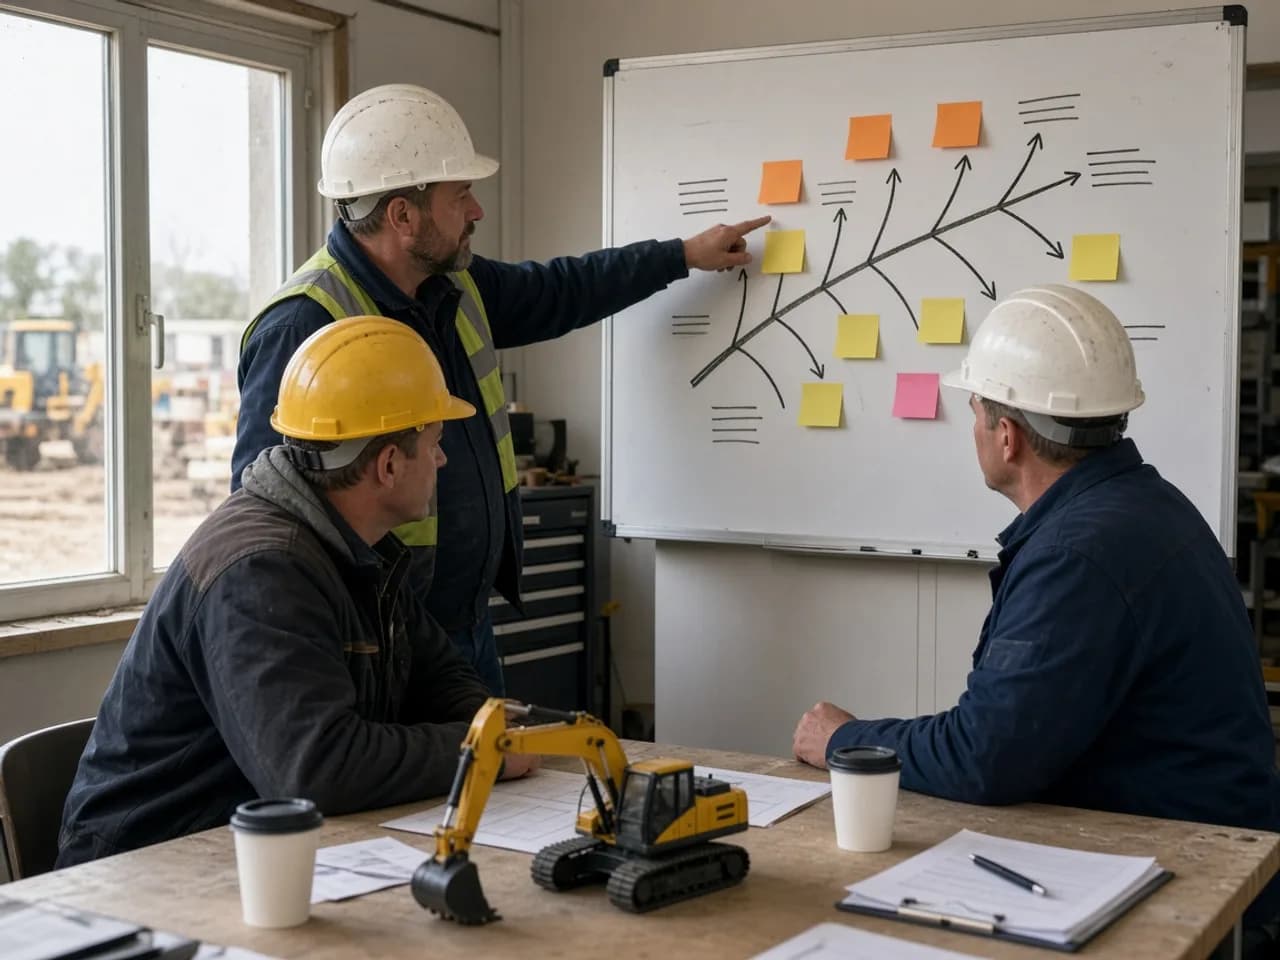
The fishbone method prevents the team from fixating on the first part that comes to mind. In heavy equipment failures, five useful main categories are operator, maintenance, parts, operating conditions and design. The categories are directions for investigation, not answers. Under each heading, causes that could be related to the event are written; then those eliminated and those confirmed by evidence are marked.
In the operator category, the way of use, shift handover, reaction to warnings and competence are examined. In maintenance, intervals, checklists, lubrication, installation method and torque application are covered. In parts, the correct reference, quality, storage, shelf life and counterfeit risk are questioned. In operating conditions, dust, water, temperature, ground, slope, load cycle and shift intensity are evaluated. In design, guarding, routing, cooling capacity, connection points and suitability for the site are examined.
Do not turn the meeting into a contest of ideas. First share the sequence of events and the evidence available, then ask each participant for possible causes. Possible causes are ranked by impact and ease of verification. For the three or four strongest hypotheses, plan a measurement, a part inspection, a field observation or a controlled trial. An unproven hypothesis cannot be the justification for an action.
- Operator: use, handover, reaction to warnings
- Maintenance: interval, inspection, installation, lubrication
- Parts: suitability, quality, storage, equivalence standard
- Operating conditions: dust, temperature, ground, load and shift
- Design: guarding, routing, capacity and accessibility
Designing corrective and preventive actions
A corrective action removes the effect of the current failure; a preventive action changes the recurrence mechanism. Renewing the burst hose is corrective. Standardising the routing, defining the right clamp, setting a minimum stock level and adding a movement check after installation are preventive. If both are not planned together, the machine returns to work quickly but can stop again for the same reason.
Every action should have an owner, target date, affected machine group, required resources, verification method and closure evidence. Training alone is a weak action; a check, fixture, work instruction or inspection point that supports the behaviour should be added. For a part change, compatibility and site conditions should be verified; for a design change, an authorised technical assessment should be obtained.
When prioritising, consider safety impact, production loss, probability of recurrence and the spread area together. An event with a low frequency but a serious safety risk can be addressed first even if it ranks low in the Pareto order. Your decision rule should be written down: a critical safety finding immediately; high downtime impact and high recurrence probability as a planned priority; a low-impact single event as monitoring.
- Which mechanism of the root cause does the action change?
- Are the owner and target date clear?
- Was a spread check made for all similar machines?
- Does the closure evidence show the result was verified, not just that the task was completed?
- Were rollback or new risk possibilities assessed?
Verifying that the action worked, and edge cases
The analysis does not close when the action is completed. The criterion chosen beforehand must be monitored for long enough under similar operating conditions. Look at questions such as: is MTBF rising, is MTTR falling, is the same symptom seen again and is total downtime intensity decreasing. A drop in the failure count alone is not enough; if the machine worked less, fewer failures are naturally seen. For this reason, use the rate per working hour.
Edge cases can easily distort the result. If the meter was replaced or reset, the working time series must be corrected. If the same event was closed and reopened, it must not be counted as two failures. If a failure began on the night shift and closed the next day, the stoppage remains a single event. If the machine worked under lighter conditions on another project for a month, the before and after comparison can be explained by the difference in conditions.
In events where part waiting time is high, MTTR does not show only technical repair capability; it also includes supply delay. In this case, active labour time, diagnosis time and part waiting time should be tracked separately. If a new preventive maintenance practice increases other failures, a local improvement can hide the overall result. Use at least one counter-measure; for example, check whether unplanned maintenance time or part consumption rises while hydraulic failures fall.
- Were the same machine group and a similar load condition compared?
- Was the difference in working hours included in the rate calculation?
- Were duplicate records of a single event merged?
- Were part waiting time and active repair time separated?
- Was the negative effect of the action on other failure types checked?
Common mistakes and the role of Reper Axis data
The first common mistake is to assume the most frequently seen failure is the largest loss. Count, downtime and severity must be measured separately. The second mistake is ending a 5 Whys chain with operator carelessness or mechanic error. Declaring the person the final cause without questioning competence, work method, parts access and the control system does not stop recurrence. The third mistake is not recording the baseline before the action; without a baseline, improvement cannot be measured.
The fourth mistake is constantly changing the categories. If the same symptom is opened under different names, the Pareto is split. The fifth mistake is making the metric look better by deleting a few selected events. If there is a data quality problem, the record is corrected and the reason is kept. The sixth mistake is counting a short failure-free period as success. When the monitoring period is shorter than the expected failure interval, the result is statistically weak.
Reper Axis opens a fault record with a photo, priority and category. When the machine is marked as unable to operate, downtime starts, and it closes when the machine is declared ready. The fault record is at the same time the fault work order that carries assignment, labour hours, part or material requests and the approval flow. Availability, MTBF, MTTR, failure and downtime history by machine, and the risk score provide data for analysis.
Reper Axis does not perform automatic root cause analysis. Choosing the Pareto scope, running the 5 Whys discussion, verifying fishbone hypotheses and deciding on the result of the action are the responsibility of the maintenance team. The value of the software is in basing these decisions on reliable event and downtime data.
- Looking only at the failure count
- Closing the root cause early with human error
- Moving to action without taking a baseline measurement
- Using the category dictionary inconsistently
- Treating a short monitoring period as certain success
- Accepting the data without interpretation as if an automatic analysis existed